Financial Modeling in DeFi Decoding the Smile Curve
When I was trading corporate bonds in a concrete‑lined warehouse, the only thing that seemed to have a pulse was the ticking of the clock on the wall. Then came the first time a friend—who’d grown up in a small coastal town in Portugal and now had his own tiny crypto wallet—called me to ask what a smile curve was. He’d heard the term in a meme about DeFi options and felt a mixture of curiosity and anxiety: “Is this a new kind of risk?” he wondered. That call set the tone for my little research notebook. That conversation, and many others since, keep me grounded in two things: the human feeling behind numbers, and the undeniable fact that the markets test patience before rewarding it.
The DeFi world is a bit like a garden that grows its own weeds. The technology gives us tools—options, swaps, flash loans—to prune, plant, and fertilise our assets. But the weeds that come in the form of volatility skew, smile curves, and implied volatility surprises can make the garden look wild. Understanding these patterns is not about making a quick profit; it’s about seeing how the soil behaves so we can plant long‑term.
Let’s zoom out: what is volatility skew?
When we talk about volatility in finance, we’re typically referring to how much a price swings over time. Imagine you’re walking a dog in a park that’s sometimes calm and sometimes stormy. If you can predict when the wind picks up, you’ll keep a leash tight or let the dog roam free. In markets, we use “volatility” as that wind.
Now consider options: a contract that gives you the right to buy (call) or sell (put) an asset at a specified price (the strike) on or before a particular date. The implied volatility is the market’s expectation of how much the underlying asset will move by the option’s expiry. Market participants price these contracts and through supply and demand, the implied volatility is set.
If you plot implied volatility against strike prices, you often see a curve that looks like a smile. The “skew” element is the asymmetry: options that are deeply out‑of‑the‑money (OTM) on one side (say deep puts) might trade with higher implied volatility than those that are OTM on the other side (deep calls). This shows that traders are willing to pay more for protection against downside risk than for upside upside.
The smile curve: a DeFi garden analogy
When I first saw a smile curve in the context of DeFi, I pictured a hedge fund manager in London staring at a giant scatter plot and feeling both awe and bewilderment. The curve’s shape is a reminder of how the market treats risk. In the garden of DeFi, we often find that the most valuable plants are not the flashy, high‑yield ones; they are the resilient, low‑risk ones.
In DeFi, you can buy options on anything that has a liquidity pool: from stablecoins to volatile tokens. The implied volatility of these options tends to be higher when the token’s volatility is high, but the relationship is further complicated by the liquidity of the underlying pool and the perceived risk of smart contract failure.
Here’s a simple analogy: imagine a fruit tree outside an apartment block. The tree is healthy, but the wind can be unpredictable. The higher the wind, the more valuable a small umbrella that protects against a rainstorm. The umbrella is the option. Its price reflects the wind’s expected intensity, not the tree’s fruit. Similarly, implied volatility is based on expected price swings, not the absolute value of the token.
Causes of volatility skew in DeFi
-
Liquidity asymmetry – The less liquidity there is on one side of an options market, the higher the implied volatility. In decentralized markets, certain pools may have fewer traders buying deep puts than deep calls, or vice versa.
-
Smart contract risk – The fear that a protocol is vulnerable to bugs or hacks makes traders pay more for downside protection. This is similar to buying a life insurance policy in anticipation of a rare but catastrophic event. You’re not buying the insurance just because the event is possible; you’re buying peace of mind because the event, while unlikely, would be devastating.
-
Regulatory uncertainty – A token that could face future regulatory changes may have its upside capped, while the downside remains a possibility, driving skew.
-
Tokenomics – Certain protocols incorporate mechanisms like staking rewards, inflationary issuance, or burn events that create non‑linear price dynamics. These structures distort the classic Black‑Scholes assumptions and thus shape the implied volatility surface.
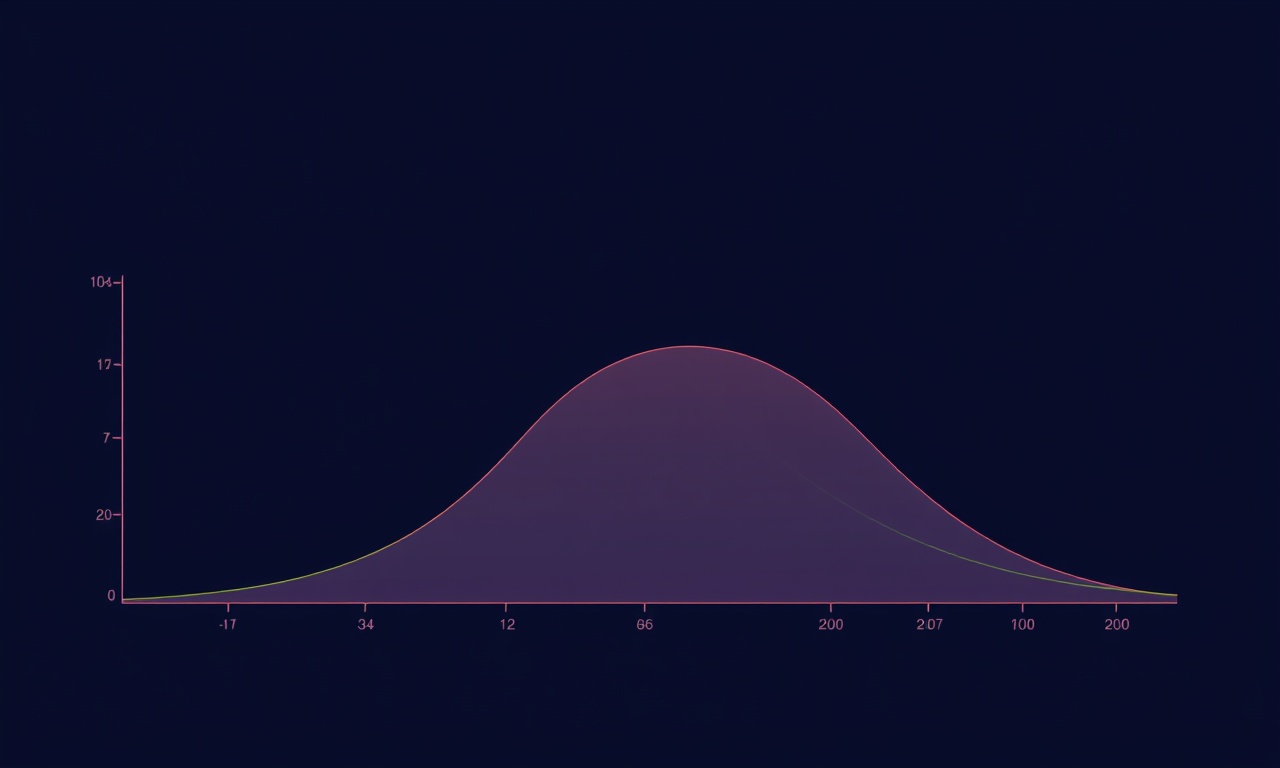
Visualizing the smile curve
The smile curve typically shows a U‑shaped pattern. Implied volatility is higher at the extremes (deep OTM puts and deep OTM calls) and lower near the at‑the‑money (ATM) region. That tells us something interesting: traders expect larger moves when the market is forced to make a choice, whether that option ends up in the money or not.
In DeFi, the curve can be more pronounced. Think of a protocol like an amusement park where the rides are the token’s price moves. The park’s most popular rides are the big, flashy ones (the underlying token), but the park’s hidden treasures are the smaller, less obvious rides (the out‑of‑the‑money options) where risk sits in higher pockets.
When we plot that, the left side of the curve (deep puts) reflects how much a trader is willing to pay to guard against a sudden plunge. The right side (deep calls) shows the price for an extreme upside, which sometimes is capped by scarcity or protocol rules, reducing demand.
The risk side of the smile curve in practice
Suppose you’re looking at a DeFi option on a stablecoin‑based derivative. The stablecoin’s price isn’t going to swing wildly—after all, it’s pegged. However, the protocol owning the derivative might be subject to a flash loan exploit that causes a sudden drop in token value. Traders, knowing that risk, will bid up the implied volatility of put options, but because puts are the “safe” side, you see a skew where puts are priced higher.
Conversely, a project that’s known for consistent yields may attract more call buyers who are looking for “free money.” The call side then experiences lower implied volatility because the upside is perceived as more attainable or less risky, reducing the price.
From smile to strategy: when to use the volatility skew
1. Hedging a long position
If you hold a large position in a token that has a steep put side but a gentle call side, you’ll find that buy‑to‑sell options are cheaper. Buying deep OTM puts on that token provides a safety net. The cost, though higher than deep calls, will be justified by the protection you gain.
2. Speculating on shift
Sometimes the skew itself can shift as external events unfold. For example, a regulatory announcement may suddenly inflate implied volatilities of puts, while calls remain relatively stable. Shorting the option that becomes overpriced relative to the underlying can be a viable play, provided you can understand the risk profile and time horizon.
3. Understanding liquidity gaps
In many DeFi platforms, liquidity for deeper OTM options is sparse. That tends to inflate implied volatility, but also means the options are often illiquid themselves, making execution difficult. When a protocol is announcing a new yield‑generating feature, you might expect a skew to flatten as new participants join the liquidity pool. Watching the skew before and after such events can give you insight into market sentiment.
The emotional undercurrents of the smile curve
When I first studied volatility skew, I was caught between fear and hope. Fear because volatile markets can wipe out capital in a flash, and hope because a well‑timed trade could double or triple a modest sum. DeFi options, with their intrinsic leverage and asymmetrical payoff, amplify both feelings. The smile curve helps temper that emotional roller coaster: it tells us that the market is assigning value to risks that are not obvious.
When traders overpay for downside protection, the market signals that fear is dominating. When upside options remain cheap, there’s a subtle suggestion that people are more excited about potential gains than cautious about losses. That’s a sentiment shift.
It’s less about timing, more about time. In the garden analogy, you don’t chase a single flower bloom; you plant consistently and let it grow. The smile curve is a compass, not a GPS. It points to where uncertainty lies, and that can guide how you water or fertilise your portfolio.
Practical steps to interpret and use smile curves in DeFi
-
Track implied volatility daily. Use a DeFi analytics platform that presents option data and displays skew. Compare it over time to see if the curve is flattening or steepening.
-
Compare related protocols. If two protocols share a similar token but one is newer, the skews might differ dramatically. Newer protocols might have higher put vol because of the unknown.
-
Watch liquidity metrics. Pay attention to the depth of the liquidity pool used to price the options. A low depth typically signals higher implied volatility. That means a higher cost for protection but also indicates an opportunity if you’re selling that protection.
-
Stay updated on security audits and code changes. Smart contracts change, as do the risks associated with them. An audit can reduce perceived risk and flatten the put side of the curve.
-
Use it in conjunction with other indicators. Pair the skew analysis with on‑chain metrics like active addresses, total value locked, and gas usage to form a holistic view.
A real‑world example: a Decentralised Exchange (DEX) option
Last year, a popular DeFi exchange introduced a new liquidity mining program. Suddenly, both the underlying token’s volatility and its options became a topic of discussion. I noticed that while the underlying token’s price hovered around a stable range, the implied volatility of deep OTM puts spiked by nearly 40%. This suggested to me that traders were worried about the sudden addition of a large fund of capital, expecting a potential crash if the liquidity didn’t pan out.
I opened a modest position: short a deep OTM put, while holding the token on the back. Over the next week, the token performed a small bullish rally as the program concluded, and the put expired worthless. I collected the premium. The point was not that I had predicted the exact movement; it was that by observing the skew, I inferred that people were overpricing protection, giving an opportune moment to capitalize.
Takeaway: Smile curves, when observed with other market factors, can signal mispricing, allowing you to act on relative value rather than chasing big moves.
Volatility skew: the mirror of market sentiment
Consider the market as a glass of water. If you pour cold water from one side, the temperature will shift unevenly, creating a visible gradient. Similarly, sudden news, a hack, or a regulatory tweak pushes volatility around options in a non‑uniform way. Skew is essentially that gradient: it tells us which side is cooling or heating faster.
People often interpret volatility skew as a negative sign—like “the market is scared.” But in DeFi, skew is a functional tool. It indicates where participants have baked in risk expectations. Understanding it is like learning to read the weather report: you’re not told whether it’s going to rain or shine, but you’ll know where to pour an umbrella or put on sunglasses.
The ethical side of trading on smile curves
When we discuss DeFi and smile curves, we have to keep in mind that these markets are still young and many participants are novices. Trading options with leverage can quickly lead to loss. It is tempting to frame skew as a “free lunch,” but that is dangerous.
I make sure to advise my students and clients that it is always important to align any trade with personal risk tolerance and overall financial goals. A strategy that exploits skew might work in theory, but in practice it can expose you to liquidity risk, smart contract risk, and sudden market moves. Transparency, discipline, and a step‑back perspective often prevent over‑confidence from taking the driver’s seat.
How to get started if you’re new to DeFi options
-
Learn the basics of option payoffs. Visualizing how payoffs look on paper clarifies the mechanics. Use a simple chart to plot a call, a put, and their combined position.
-
Check your exchange’s options market. Many protocols provide a visual interface; examine implied volatility charts and see how the skew looks.
-
Experiment with paper trading. Use a sandbox environment to practice buying and selling options without risking real capital. This helps you feel the liquidity and pricing dynamics.
-
Keep a journal. Record why you entered each position, what you observed about volatility skew, and the outcome. The practice of journaling keeps you honest and brings clarity over time.
-
Engage with the community. Many DeFi projects host AMAs, Discord servers, or Telegram chats. Engaging can help you understand how others perceive risk and volatility.
Grounded, actionable takeaway: Use the smile curve not as a forecast of price movement, but as a reality check on how the market views risk. When the curve shows deep puts inflating, think of it as a sign that markets expect downside; if that aligns with your view that a token might wobble, you might consider a protective position. Conversely, if the call side is cheap, that could hint that the market underestimates upside, maybe presenting an opportunity to capture premium by selling calls.
Let’s zoom out a bit more. The world of DeFi is akin to a landscape that shifts under a constantly changing sky. Volatility skew is a piece of the weather data. It doesn’t replace fundamentals or macro analysis, but it offers a lens that highlights where risk and opportunity co‑exist. In the garden of DeFi, the smile curve is a reminder that the most fertile ground is often the one that looks a little cracked—or that offers a small, reliable drip of risk mitigation.
When you walk through the markets, use the skew to understand how your fellow traders see the wind. Use that understanding to decide whether to plant a deep‑rooted hedge, to nurture a quick‑growing venture, or simply to hold your ground. Remember, markets test patience before rewarding it. By learning to read the smile curve, you’re better prepared to ask the right questions, pause when needed, and act when an opportunity aligns with both the numbers and your goals.

.png)
Lucas Tanaka
Lucas is a data-driven DeFi analyst focused on algorithmic trading and smart contract automation. His background in quantitative finance helps him bridge complex crypto mechanics with practical insights for builders, investors, and enthusiasts alike.
Discussion (5)
Join the Discussion
Your comment has been submitted for moderation.
Random Posts

Incentive Modeling to Amplify Yield Across DeFi Ecosystems
Discover how smart incentive models boost DeFi yields while grounding gains in real risk management, turning high APYs into sustainable profits.
4 weeks ago

Risk Adjusted Treasury Strategies for Emerging DeFi Ecosystems
Discover how to build a resilient DeFi treasury by balancing yield, smart contract risk, governance, and regulation. Learn practical tools, math, and a real world case study to safeguard growth.
3 weeks ago

Advanced DeFi Project Insights: Understanding MEV, Protocol Integration, and Liquidation Bot Mechanics
Explore how MEV drives profits, how protocols interlink, and the secrets of liquidation bots, essential insights for developers, traders, and investors in DeFi.
4 months ago

Building a DeFi Library with Core Concepts and Protocol Vocabulary
Learn how to build a reusable DeFi library: master core concepts, essential protocol terms, real versus inflationary yield, and step by step design for any lending or composable app.
6 months ago

Decoding DeFi Foundations How Yield Incentives And Fee Models Interlock
Explore how DeFi yields from lending to staking are powered by fee models that interlock like gears, keeping users engaged and the ecosystem sustainable.
6 months ago
Latest Posts

Foundations Of DeFi Core Primitives And Governance Models
Smart contracts are DeFi’s nervous system: deterministic, immutable, transparent. Governance models let protocols evolve autonomously without central authority.
2 days ago

Deep Dive Into L2 Scaling For DeFi And The Cost Of ZK Rollup Proof Generation
Learn how Layer-2, especially ZK rollups, boosts DeFi with faster, cheaper transactions and uncovering the real cost of generating zk proofs.
2 days ago

Modeling Interest Rates in Decentralized Finance
Discover how DeFi protocols set dynamic interest rates using supply-demand curves, optimize yields, and shield against liquidations, essential insights for developers and liquidity providers.
2 days ago